Potential students need to send the following information when applying for a project: (1) a motivation letter stating their skills and background with respect to the project and information about work occupation and physical presence in Linz, and (2) transcripts and recommendation letters (optional). Note, that we only assign topics to students that are enrolled in KUSSS for the corresponding course (i.e., practicum, seminar, thesis) of the institute. Dropping out after topic assignment will result in a negative grade.
Registration period: Thu 30.01.25 - Thu 06.03.25 (23:59)
More information about our thesis track (seminar + practicum + thesis seminar all on the same topic) and paper track (summarizing a scientific publication during the seminar) can be found here.
Visualizing the Evolution of AI-Generated Images
Topics: text-to-image, Human-AI Interaction, Visualization
Supervision: Amal Alnouri, Andreas Hinterreiter, Marc Streit
Contact: vds-lab(at)jku.at
Type: BSc Practical Work, BSc Thesis, MSc Practical Work, MSc Thesis
Text-to-image models have unlocked new possibilities for creativity. However, users often encounter challenges when guiding the iterative process of refining generated images, making it difficult to achieve their desired results. This project aims to address this problem by developing a visual interactive tool that allows users to visualize the transformation of AI-generated images through the iterations. By providing visual cues to highlight areas of change, the tool will help users better understand how their prompts influence the generated images. It will showcase aspects such as structural alterations and stylistic shifts, offering a comprehensive view of the image's evolution.
Relevant Paper: PrompTHis: Visualizing the Process and Influence of Prompt Editing during Text-to-Image Creation, opens an external URL in a new window

Developing a serous game for blood donation
Topics: game analytics, visualization
Supervision: Claire Dormann
Contact: clarie.dormann@jku.at
Type: MSc Thesis, MSc Practicum
Although in Europe blood shortages are not that common, they can occur punctually as for example the results of pandemics or catastrophes. Moreover, finding donors might difficult for some rarer blood groups. The Lower Austrian Medical Association was appealing to the public to donate blood. Blood donation is organised yearly on the JKU campus.
Will you help! The aim of this project is to create a casual game to stimulate blood donation. After gathering further information on blood donation and current needs the student will analyse existing games in any format. The student will start to develop conceptual designs for the game. Thereafter, following an iterative design process, a game prototype will be developed, implemented and assessed. The game will be developed from conceptual design to the implementation of a prototype. While doing so issues and components related to gameplay, target group, and evaluation will be defined.

DeepField
Topics: image processing, machine learning, hail damage, harvest estimation, climate change, drones
Supervision: Oliver Bimber, Mohamed Youssef
Contact: oliver.bimber(at)jku.at
Type: BSc Practicum, MSc Practicum, BSc Thesis, MSc Thesis
Description
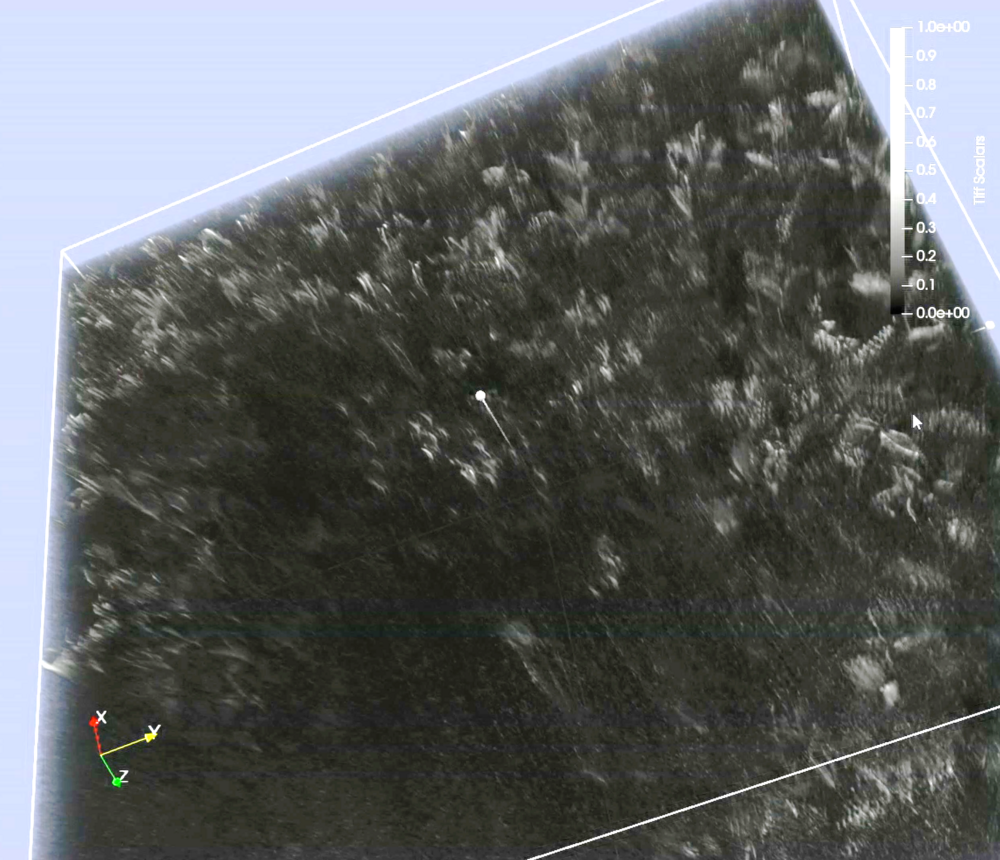
This pilot study is to investigate the potential of Airborne Optical Sectioning (AOS, GitHub/JKU-ICG/AOS, opens an external URL in a new window), a novel synthetic aperture sensing technique developed by JKU, to agriculture. It has been explored for occlusion removal of forest in search and rescue, wildlife observation, wildfire detection, surveillance, archeology, and forest ecology. Here, we want to evaluate how efficient AOS can be applied for harvest estimation and damage caused by hail. It might have the potential to tomographically reconstruct corn and wheat fields with drones, and to automatically estimate damage and harvest yield with AI techniques. This pilot study will be carried out in cooperation with the Austrian Hagelversicherung who, if successful, will be a partner for a follow-up project proposal or will provide direct funding for a follow-up project. The student will implement and evaluate a novel tomographic reconstruction approach.
In this project we want to explore new scanning techniques with drones for volumetric field reconstruction, as well as novel depth-from-defocus and 3D classification techniques for detecting essential vegetation properties (e.g., size and weight of corn).
DeepForest
Topics: image processing, machine learning, forest ecology, climate change
Supervision: Oliver Bimber, Mohamed Youssef
Contact: oliver.bimber(at)jku.at
Type: BSc Practicum, MSc Practicum, BSc Thesis, MSc Thesis
Description
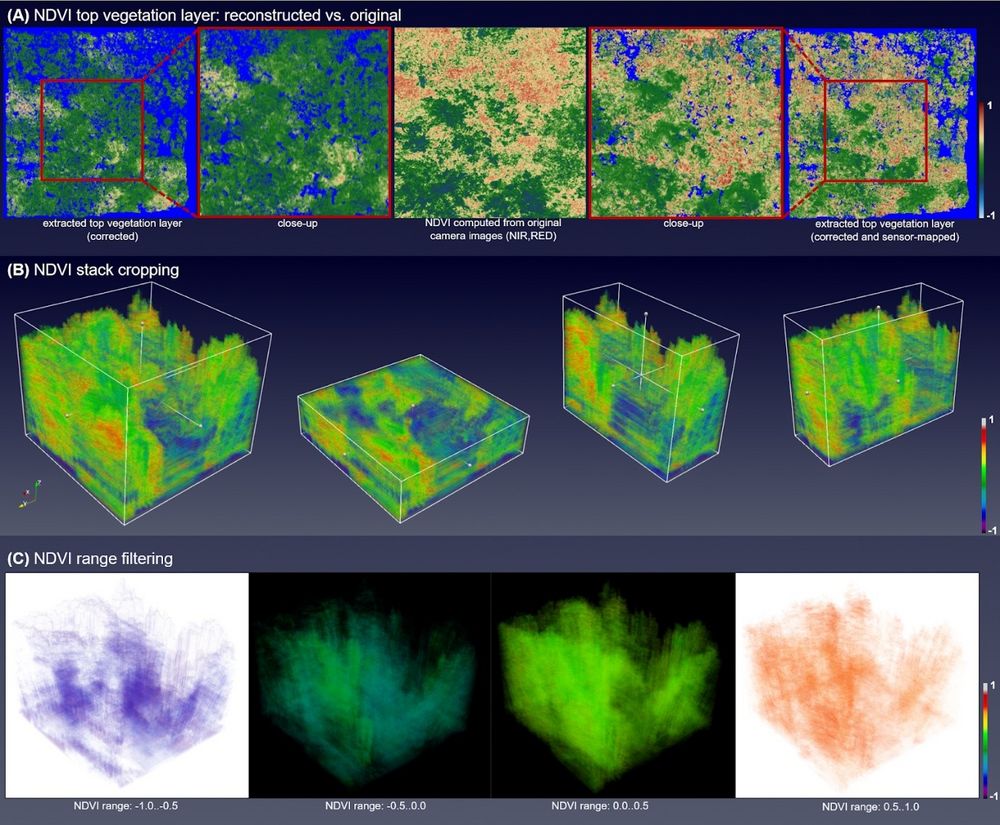
Access to below-canopy volumetric vegetation data is crucial for understanding ecosystem dynamics, such as understory vegetation health, carbon sequestration, and habitat structure, and biodiversity. We address a long-standing limitation of remote sensing, which often fails to penetrate below dense canopy layers. Thus far, LiDAR is considered the only option for measuring 3D vegetation structures, while camera sensors are only capable of extracting reflectance and depth of top vegetation layers. Our approach offers sensing deep into self-occluding vegetation volumes, such as forests, using conventional aerial images. It is similar, in spirit, to the imaging process of wide-field microscopy – yet handling much larger scales and strong occlusion. We scan focal stacks through synthetic aperture imaging with drones and remove out-of-focus contributions using pre-trained 3D convolutional neural networks. The resulting volumetric reflectance stacks contain low frequent representations of the vegetation volume. Combining multiple reflectance stacks from various spectral channels provides insights into plant health, growth, and environmental conditions throughout the entire vegetation volume.
In this project we want to explore how our 3D CNN architecture can be enhanced by a consistency regularization in our loss function which will suppress spatial noise during the training process and to differentiate void points (air) from surface points (vegetation). Furthermore, we are seeking solutions for performance optimization. Note, that this project requires good machine learning skills.
Sound augmentation for digitally enhanced play: adding sound to cartographic video game maps
Topics: cartographic game maps, sound, video game
Supervision: Claire Dormann and Günter Wallner
Contact: claire.dormann (at)jku.at
Type: BSc Thesis, MSc Practicum, MSc Thesis
Description
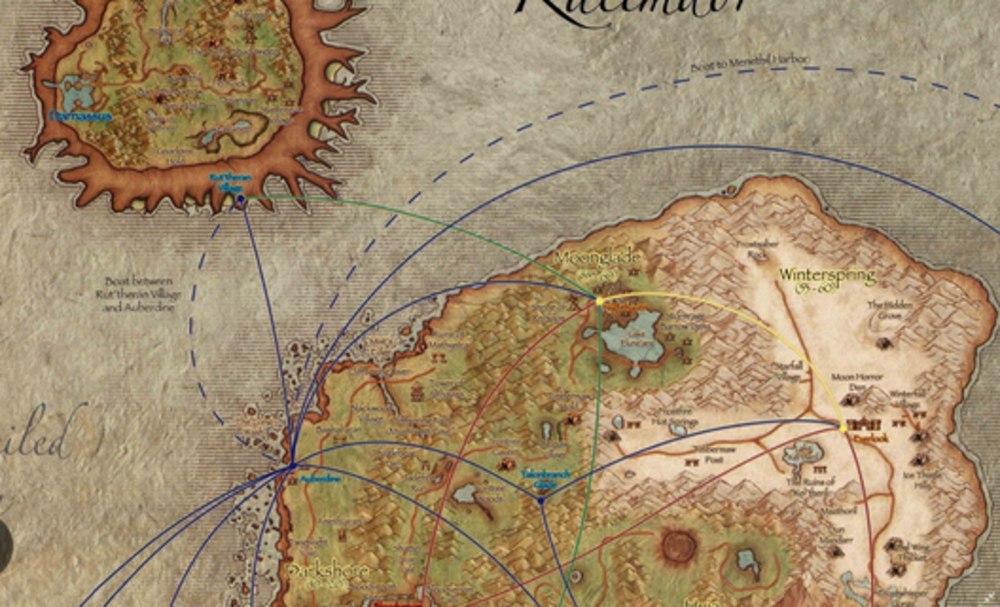
Sound is an important design aspect both of cartography and video games. However, it is not used in conjunction to game maps. In cartography, auditory icons are utilised to translate or complement visual data. Sound could also be used to convey gameplay information on a map. In games, sound is designed to create atmospheres, and / or trigger emotions. The ambient music in Assassin Creed Mirage creates a mood evocative of the ancient middle-eastern culture, and is designed to absorb players in the game. While players explore a game map, they could hear the many sounds of a game city, or a region (part of a world map).
Tasks
The first step of this project consists in exploring the use of sound (including music and sound effects) for game cartographic maps. Next, examples would be selected and implemented for a specific game map. The sonified map(s) will be produced as a mod game map, for example using World of Warcraft tools.
Requirements
● Interest in sound
● Good programming skills
● Interest in game development and game map design
● Knowledge of Word or Warcraft
Call of Duty: Warzone Movement Analytics and Visualization
Topics: game analytics, visualization
Supervision: Günter Wallner
Contact: guenter.wallner(at)jku.at
Type: MSc Thesis, MSc Practicum
Description
Activision recently released one of the largest available data sets from an AAA video game. The Call of Duty Caldera dataset includes the full map geometry as well as player data from 1 million players, particularly end points of play and trajectories. Navigation is a key element in video games and understanding movement patterns is of key interest for level design. This can benefit from visualizations that display the data directly within the level environment.
Tasks
The goal of this project is to first analyze and document the dataset and to setup a research environment to use the dataset for research purposes. Next, the included trajectory data should be analyzed and a visualization method for displaying navigational patterns be developed. This will involve reseaching appropriate methods such as the application of abstraction and/or aggregation methods (e.g., graph-based approaches).
Requirements
● Good programming skills
● Good data processing skills
● Interest in game development and design
● Interest and/or experience with visualization
● Willingness to crack problems and to show self-initiative
● Knowledge of Call of Duty is an advantage
Links
● GitHub - Activision/caldera, opens an external URL in a new window
● Blog Activision, opens an external URL in a new window

Understanding the Transition to Commercial Dashboarding Systems
Topics: visualization, dashboarding systems, qualitative study
Supervision: Conny Reis, Marc Streit
Contact: vds-lab(at)jku.at
Type: BSc Practical Work, and possibly a subsequent BSc Thesis
Description
Many long-established, traditional manufacturing businesses are becoming more digital and data-driven to improve their production. These companies are embracing visual analytics in these transitions through their adoption of commercial dashboarding systems such as Tableau and MS Power BI.
However, transitioning work practices to a new software environment, is often confronted with technical but also socio-technical challenges [Walchshofer et al. 2023, opens an external URL in a new window]. Walchshofer et al. conducted an interview study with 17 workers from an industrial manufacturing company and reported on observations such as hidden/underappreciated labor or a visualization knowledge gap leading to discomfort with interaction in dashboards. As this study represents just a snapshot of time during a lengthy transition process, this student topic focuses on a follow-up study to understand how these challenges change over time.
The goal of this project is to contribute to the design and execution of a qualitative study. No programming knowledge is required. In collaboration with Linköping University (Sweden), we will develop questions for an interview series and conduct the interviews. Audio recordings of these interviews then need to be transcribed and analyzed. The findings need to be compared with the study's results by Walchshofer et al.

Lost My Way
Topics: game development, educational games, web programming
Supervision: Günter Wallner
Contact: guenter.wallner(at)jku.at
Type: MSc Thesis, MSc Practicum
Description
Games have shown to be engaging and valuable tools for education. As such many educational games have been developed to date for a variety of educational topic ranging from language learning to mathematics. At the same time educational games are challenging to design as they need to effectively communicate educational content while being entertaining to play. The goal of this work is to a) convert a previously in Adobe Flash developed game for geometry learning to HTML 5 and deploy it and b) conduct a user study to ascertain its value.
Tasks
Work will include converting the game from Adobe Flash (source code and assets will be provided) into HTML5. The game needs to include logging facilities to be able to reconstruct the solutions to the levels. The converted game needs to be deployed on a web server (space will be provided) and subsequently evaluated with players (e.g., via an online study).
Requirements
● Good programming skills
● Knowledge of HTML 5 and web development
● Knowledge of Adobe Flash is of advantage
● Interest in game development and design

Visualization and Explanation of ML-Based Indiciation Expansion in Knowledge Graphs
Topics: visualization, explainable AI, knowledge graphs, healthcare
Supervision: Christian Steinparz, Marc Streit
Contact: vds-lab(at)jku.at
Type: MSc Practical Work, MSc Thesis
Description
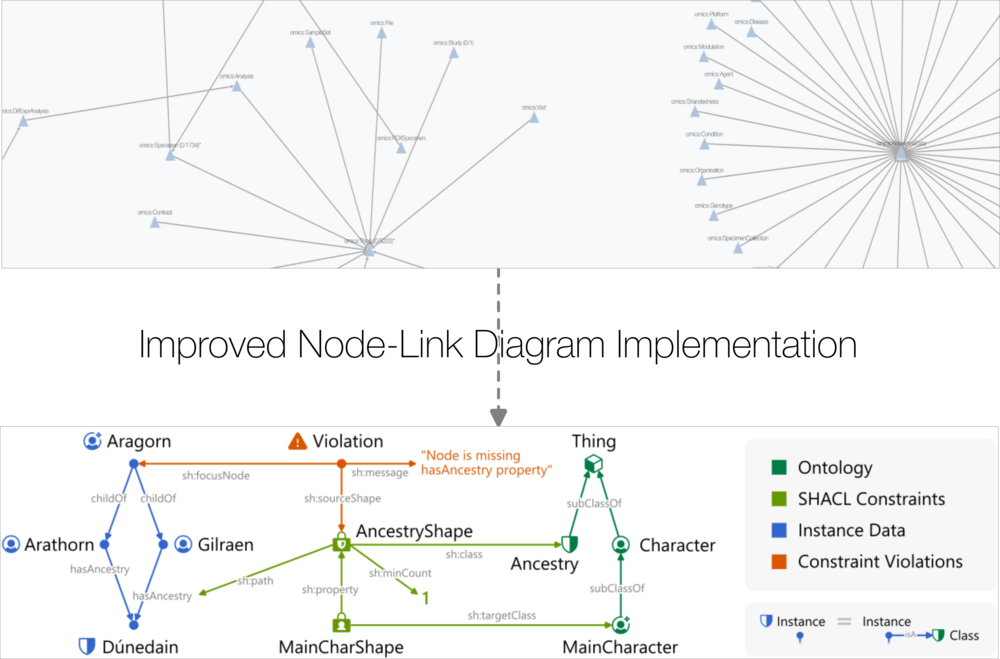
Indication expansion involves identifying new potential uses or "indications" for existing drugs. One way to find new indications is to analyze the connections and relationships within pharmaceutical data, including experimental data and literature. Our collaboration partner employs a machine learning model to predict new links in their knowledge graphs, intending to discover relationships between current drugs and diseases for which they have not been previously used. The project focuses on effectively visualizing and explaining these newly predicted links, enabling domain experts to determine the potential of further research into each drug's new possible uses.
 Image adapted from the presentation of Knowledge Graphs for Indication Expansion: An Explainable Target-Disease Prediction Method (Gurbuz et al. 2022): https://www.youtube.com/watch?v=ADszHqJhr2Y&ab_channel=BiorelateLtd.
Visual Analysis of Medical Patient Event Sequences From the MIMIC-IV Database
Topics: medical data, healthcare, patient data, data visualization, event sequence visualization
Relevant Paper: https://www.nature.com/articles/s41597-022-01899-x, opens an external URL in a new window
Supervision: Christian Steinparz, Marc Streit
Contact: vds-lab(at)jku.at
Type: BSc Practical Work, potential subsequent BSc Thesis, MSc Practical Work, potential subsequent MSc Thesis
Description
We are collaborating with the Nanosystems Engineering Lab (NSEL) at ETH Zürich. The researchers at NSEL are analyzing data on anastomotic leakage, a serious complication where the surgical connection between two body parts, such as blood vessels or intestines, fails and leaks.
In this project, you will use the MIMIC-IV database, which includes hospital patient data related to procedures and diagnoses associated with anastomotic leakage. You will create a suitable data structure, extract the relevant data from MIMIC-IV, and develop visualizations to analyze certain aspects of the data. For instance, the visualization should answer the question “What is the ratio of procedures of type A that lead to anastomotic leakage diagnosis type B”.
An example patient event sequence looks like this:
Patient 1: admission → discharge → admission → procedure “Other small to large intestinal anastomosis” which could trigger leakage → diagnosis “digestive system complications, not elsewhere classified” → diagnosis “Abscess of intestine”
Each event has a low amount of additional metadata such as the date.
We have already created and will provide a JSON file with a data processing pipeline, and a basic Sankey diagram for the patient event data, that you can refine and build on.
Basic Observable Notebook For Visualizing Patient Event Data, opens an external URL in a new window

Automating Visualization Configurations to Show/Hide Relevant Aspects of the Data
Topics: data visualization, degree of interest, projection, trajectory data, user intent, human-computer interaction (HCI)
Supervision: Christian Steinparz, Marc Streit
Contact: vds-lab(at)jku.at
Type: MSc Seminar, Practical work, and potential follow-up MSc Thesis
Description
We are developing a modular specification for calculating the Degree of Interest (DoI) in visualizing high-dimensional trajectory data. DoI defines interest in visual elements based on user input, hiding less relevant elements and emphasizing the most interesting ones.
Using chess data as an example, each game is a trajectory, with moves and board states visualized in a scatter plot. A user might query for games starting with a specific opening, driving the DoI to focus on relevant points and lines and also propagating high DoI to their surroundings.
This DoI specification includes a large amount of possible user configurations: How strong should DoI be propagated via embedding proximity, or along the future of trajectories, or the past, or in dense versus sparse areas, for points, for edges, for labels, etc.?
Your task in this project is to conceptualize a way to find (near) optimal configurations automatically and create a web-based prototype. This includes devising, categorizing, and reasoning about aspects such as data properties and user intent, and figuring out which configuration is optimal for which circumstance. E.g., when data is extremely dense and hierarchical, and users want to compare sparse outliers. The underlying DoI specification is already given.
An interactive example prototype can be found here., opens an external URL in a new window

Using AutoML for Dimension Reduction
Topics: AutoML, Dimension reduction, Embeddings, t-SNE, UMAP
Supervision: Andreas Hinterreiter, Marc Streit
Contact: vds-lab(at)jku.at
Type: MSc Practical Work, MSc Thesis
Description
Automated machine learning (AutoML) is the process of automatically selecting the best machine learning pipelines from a vast pool of potential candidates. For classification and regression models, AutoML is routinely applied to automatically find suitable pipelines that include preprocessing, feature construction, feature selection, and model selection.
The aim of this project is to explore the application of AutoML to a different class of machine learning algorithm, namely dimension reduction. Such algorithms use unsupervised learning to reduce the number of dimensions of an input dataset while conserving certain types of information (e.g., item similarity or neighborhood). Typical examples of dimension reduction algorithms are t-SNE and UMAP. We hypothesize that AutoML can be used to find suitable settings of hyperparameters and preprocessing steps for such techniques, enabling the creation of low-dimensional data representations that adhere to certain quality measures or visual perceptual properties.
Links to additional resources:
● TPOT, opens an external URL in a new window, an AutoML tool for Python
● Distill article, opens an external URL in a new window illustrating the effects of hyperparameter settings for t-SNE
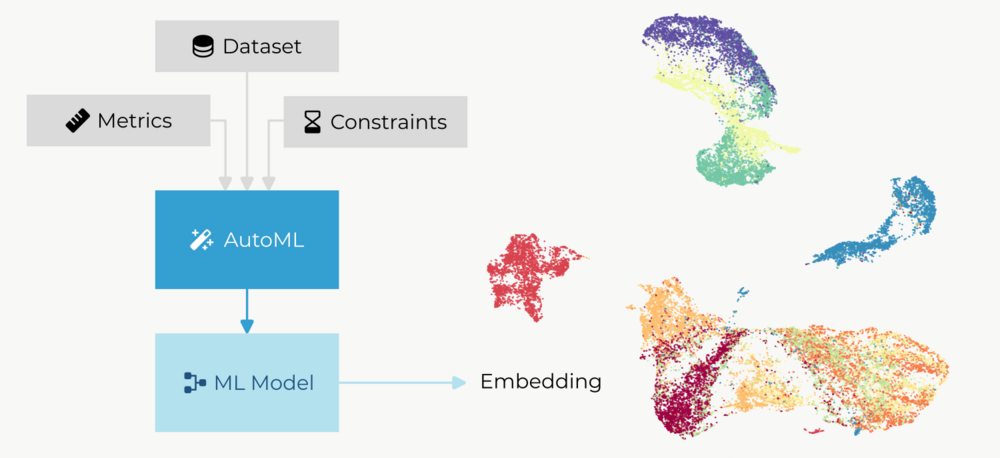 Embedding scatterplot taken from https://umap-learn.readthedocs.io/en/latest/plotting.html.
Visual Tracking of LLM Output Evolution
Topics: LLM, Human-AI Interaction, Visualization
Supervision: Amal Alnouri, Andreas Hinterreiter, Marc Streit
Contact: vds-lab(at)jku.at
Type: BSc Practical Work, BSc Thesis, MSc Practical Work, MSc Thesis
Description
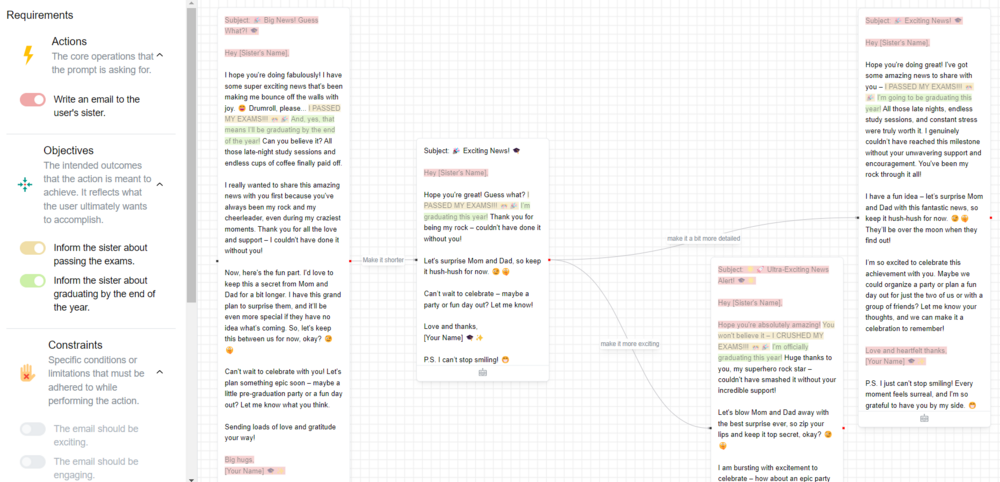
As Large Language Models (LLMs) become integral to text generation and reformulation tasks, there is a growing need for tools that enhance user understanding and control over the output. While LLMs can produce highly sophisticated text, users often struggle to evaluate and control this output especially when dealing with iterative edit prompts. This project aims to address the gap in transparency and user comprehension by developing an interactive visual tool that allows users to visually track the evolution of LLM-generated text over multiple interactions. By clearly displaying differences in the generated texts and providing key metrics as users refine their prompts, the tool will help them assess the extent to which the LLM outputs align with their expectations, make informed decisions, and gain deeper insights into how the model's responses evolve with each input variation.
Drone-Based Wildfire Detection
Topics: drones, image processing, classification, machine learning
Supervision: Oliver Bimber, Mohamed Youssef
Contact: oliver.bimber(at)jku.at
Type: BSc Practicum, MSc Practicum, BSc Thesis, MSc Thesis
Airborne Optical Sectioning (AOS) is a wide synthetic-aperture imaging technique that employs manned or unmanned aircraft, to sample images within large (synthetic aperture) areas from above occluded volumes, such as forests. Based on the poses of the aircraft during capturing, these images are computationally combined to integral images by light-field technology. These integral images suppress strong occlusion and reveal targets that remain hidden in single recordings.
In this project we want to explore ML-based classification options for early wildfire detection. In previous projects, students explored and implemented ML-based image generation to produce many synthetic groundfire images from a limited number of real ones (using diffusion models), as well as procedural forest simulations to generate random occlusion above ground fire (using Gazebo thermal simulations). We now have a sophisticated database for training classifiers on how to detect ground fire under strong occlusion conditions, such as below dense forest. This is what this project is about: using the existing training and explore, implement, and evaluate classification options (e.g., semantic labeling). A good background in ML techniques is required.
Details on AOS:
https://github.com/JKU-ICG/AOS/, opens an external URL in a new window
 ©Image Source: https://www.thomasnet.com/insights/3-ways-technology-can-fight-the-australian-wildfires/
 Go to JKU Homepage


