Program for the visualization of poles and zeros from s- and z- transfer functions
Maximilian Wildfellner

Supervision: Univ.-Prof. Dipl.-Ing. Dr. Bernhard Zagar
Digital signal processing is a scientific field, which has been growing steadily for the past fifty years and can be found in almost all electronic systems. Therefore it is important for a technician, especially in the field of electronics, to understand the fundamentals of this subject.
In order to be able to teach these fundamentals more easily at the university, a program with a graphical user interface was created as part of this bachelor thesis, with which important relationships between transfer function and transfer behavior can be visualized.
Based on an analysis of the software requirements, a graphical user interface was developed and programmed in the Matlab environment.
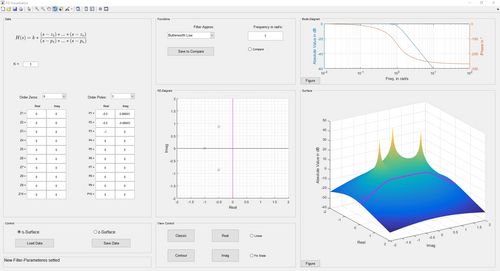
The resulting program has an interactive pole-zero-diagram in which the poles and zeros can be selected and moved with the mouse. Furthermore, additional functions for approximating filters, for comparing transfer functions and for testing them have been implemented. Finally, there was created a way to save and load the actual parameters of the transfer function to increase the user-friendliness of the program.
 Figure 1: Graphical user interface of the program
Keywords: Matlab, transfer function, pole-zero-diagram, bode-plot
September 12th, 2020
 Go to JKU Homepage


